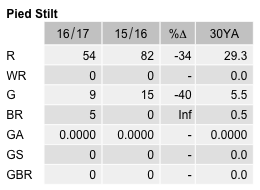
Pied Stilt
Himantopus leucocephalus
ABR description
The following is extracted from the Annual Bird Report for the twelve months to June 2017.
Uncommon, breeding visitor
Occasionally seen at JWNR, but most observations from LBath and LGeo.
General: Number of birds, 823, (up 1% on last year), but lower than the 10YA. Sightings down 34%, reporting rate down 45% and abundance all below last year, with reporting rate 0.4%, lowest since 2012 and abundance, 0.0582, substantially less than 10 & 30YAs. Spring records, 12.7%, are 80% below 2016 percentage and substantially less than long- term averages. Max 250/20 Feb l LBath E (LeM1), mean 15 (both up on 2016), median 4, (down 1). Most birds seen outside ACT, with 13 records of 4-250 birds from sites around LBath between Aug and Apr. JWNR/FSW had 23 records of 1-6 birds between Jan and Mar, often repeat reports of birds over a short period. 5 breeding records, all dy, LBath, Southern Morass 28 Oct to 22 Jan. Breeding has previously been reported only in 1994, 1997, 2006, 2012 and 2015, all outside the ACT.
Abundance
Abundance is the average number of birds of that species per survey. Where the species was observed (presence recorded) but the number of birds seen was not recorded, this is treated as a count of zero.
Abundance by year
This chart shows the abundance of Pied Stilt between 1982 and 2017. 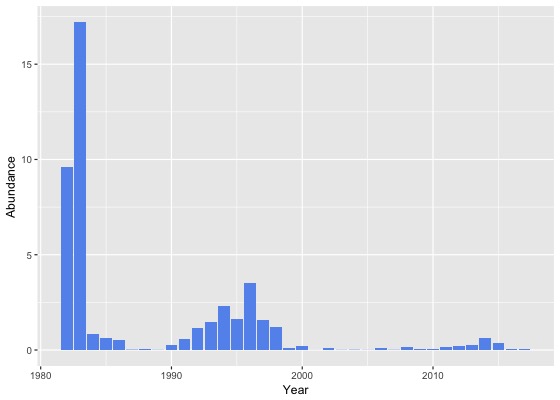
Abundance by month
This chart shows the monthly abundance of Pied Stilt. The blue lines show the abundance for the twelve months to June 2017 and the bars show the average abundance for the period 1982 to 2017. 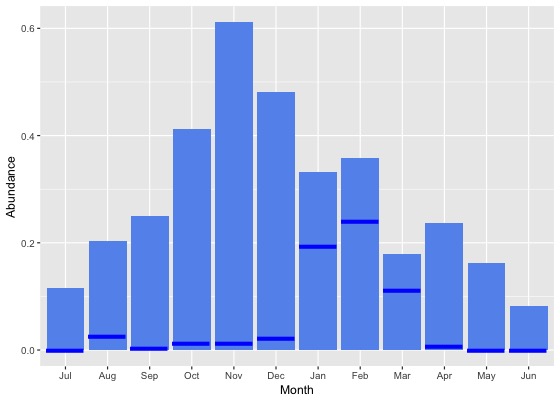
Abundance by season
This chart shows the seasonal abundance of Pied Stilt. The blue lines show the seasonal abundance for the twelve months to June 2017 and the bars show the average seasonal abundance for the period 1982 to 2017. 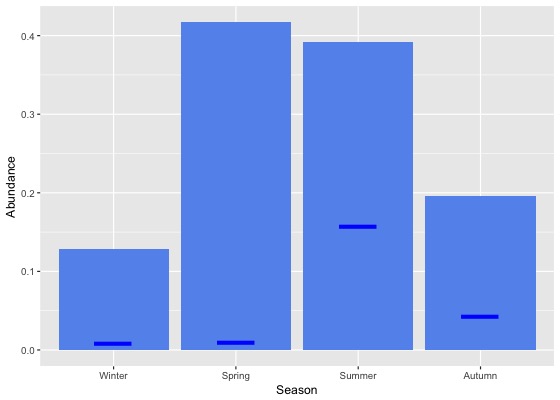
Abundance data
| Month | Season | ||||||||||||||||||
|---|---|---|---|---|---|---|---|---|---|---|---|---|---|---|---|---|---|---|---|
| Period | Jul | Aug | Sep | Oct | Nov | Dec | Jan | Feb | Mar | Apr | May | Jun | Winter | Spring | Summer | Autumn | All | ||
| All years | |||||||||||||||||||
| All | 0.1 | 0.2 | 0.3 | 0.4 | 0.6 | 0.5 | 0.3 | 0.4 | 0.2 | 0.2 | 0.2 | 0.1 | 0.1 | 0.4 | 0.4 | 0.2 | 0.3 | ||
| Previous years | |||||||||||||||||||
| All previous years | 0.1 | 0.2 | 0.3 | 0.5 | 0.7 | 0.6 | 0.4 | 0.4 | 0.2 | 0.3 | 0.2 | 0.1 | 0.2 | 0.5 | 0.4 | 0.2 | 0.3 | ||
| Previous 30 years | 0.1 | 0.2 | 0.3 | 0.4 | 0.6 | 0.5 | 0.3 | 0.3 | 0.2 | 0.3 | 0.2 | 0.1 | 0.1 | 0.4 | 0.4 | 0.2 | 0.3 | ||
| Previous 20 years | 0.1 | 0.2 | 0.3 | 0.4 | 0.5 | 0.3 | 0.1 | 0.2 | 0.1 | 0.1 | 0.2 | 0.0 | 0.1 | 0.4 | 0.2 | 0.1 | 0.2 | ||
| 10 year groups | |||||||||||||||||||
| [2007,2017) | 0.1 | 0.2 | 0.3 | 0.4 | 0.5 | 0.2 | 0.1 | 0.2 | 0.1 | 0.1 | 0.2 | 0.0 | 0.1 | 0.4 | 0.1 | 0.1 | 0.2 | ||
| [1997,2007) | 0.0 | 0.1 | 0.1 | 0.3 | 0.5 | 0.4 | 0.2 | 0.3 | 0.1 | 0.0 | 0.0 | 0.0 | 0.1 | 0.3 | 0.3 | 0.0 | 0.2 | ||
| [1987,1997) | 0.3 | 0.4 | 0.4 | 0.7 | 1.3 | 1.6 | 1.3 | 0.8 | 0.7 | 1.1 | 0.3 | 0.4 | 0.4 | 0.8 | 1.2 | 0.7 | 0.8 | ||
| 5 year groups | |||||||||||||||||||
| [2012,2017) | 0.1 | 0.2 | 0.4 | 0.6 | 0.6 | 0.3 | 0.1 | 0.2 | 0.2 | 0.2 | 0.2 | 0.0 | 0.1 | 0.5 | 0.2 | 0.2 | 0.3 | ||
| [2007,2012) | 0.0 | 0.1 | 0.1 | 0.1 | 0.2 | 0.0 | 0.1 | 0.1 | 0.0 | 0.1 | 0.2 | 0.0 | 0.0 | 0.1 | 0.1 | 0.1 | 0.1 | ||
| [2002,2007) | 0.0 | 0.1 | 0.1 | 0.1 | 0.1 | 0.0 | 0.1 | 0.0 | 0.0 | 0.0 | 0.0 | 0.0 | 0.0 | 0.1 | 0.1 | 0.0 | 0.0 | ||
| [1997,2002) | 0.1 | 0.2 | 0.2 | 0.6 | 0.9 | 1.0 | 0.3 | 0.5 | 0.1 | 0.0 | 0.1 | 0.0 | 0.1 | 0.5 | 0.6 | 0.1 | 0.4 | ||
| [1992,1997) | 1.0 | 1.1 | 1.2 | 1.7 | 3.8 | 5.2 | 3.1 | 2.1 | 1.6 | 2.4 | 0.7 | 1.1 | 1.1 | 2.3 | 3.5 | 1.6 | 2.1 | ||
| [1987,1992) | 0.0 | 0.0 | 0.1 | 0.1 | 0.0 | 0.0 | 0.3 | 0.3 | 0.1 | 0.4 | 0.1 | 0.0 | 0.0 | 0.1 | 0.2 | 0.2 | 0.1 | ||
| Year | |||||||||||||||||||
| 2017 | 0.0 | 0.0 | 0.0 | 0.0 | 0.0 | 0.0 | 0.2 | 0.2 | 0.1 | 0.0 | 0.0 | 0.0 | 0.0 | 0.0 | 0.2 | 0.0 | 0.1 | ||
| 2016 | 0.0 | 0.0 | 0.4 | 0.2 | 0.1 | 0.0 | 0.0 | 0.0 | 0.0 | 0.0 | 0.0 | 0.0 | 0.0 | 0.2 | 0.0 | 0.0 | 0.1 | ||
| 2015 | 0.5 | 0.4 | 0.4 | 1.5 | 1.3 | 0.1 | 0.0 | 0.0 | 0.0 | 0.0 | 0.0 | 0.0 | 0.2 | 1.1 | 0.0 | 0.0 | 0.4 | ||
| 2014 | 0.0 | 0.0 | 0.6 | 0.9 | 0.7 | 1.5 | 0.1 | 0.8 | 0.6 | 1.0 | 1.2 | 0.0 | 0.0 | 0.8 | 0.6 | 0.9 | 0.6 | ||
| 2013 | 0.0 | 0.7 | 0.1 | 0.2 | 0.2 | 0.3 | 0.5 | 0.1 | 0.5 | 0.3 | 0.2 | 0.1 | 0.3 | 0.2 | 0.3 | 0.4 | 0.3 | ||
| 2012 | 0.1 | 0.0 | 0.3 | 0.4 | 0.6 | 0.1 | 0.0 | 0.8 | 0.0 | 0.0 | 0.3 | 0.0 | 0.0 | 0.4 | 0.2 | 0.1 | 0.2 | ||
| 2011 | 0.0 | 0.0 | 0.1 | 0.0 | 0.0 | 0.0 | 0.2 | 0.4 | 0.0 | 0.3 | 0.5 | 0.1 | 0.1 | 0.0 | 0.2 | 0.3 | 0.1 | ||
| 2010 | 0.0 | 0.1 | 0.1 | 0.1 | 0.0 | 0.0 | 0.0 | 0.0 | 0.0 | 0.0 | 0.0 | 0.0 | 0.0 | 0.1 | 0.0 | 0.0 | 0.0 | ||
| 2009 | 0.0 | 0.0 | 0.1 | 0.0 | 0.1 | 0.0 | 0.1 | 0.0 | 0.1 | 0.0 | 0.0 | 0.0 | 0.0 | 0.1 | 0.0 | 0.0 | 0.0 | ||
| 2008 | 0.0 | 0.2 | 0.1 | 0.5 | 0.8 | 0.0 | 0.0 | 0.0 | 0.0 | 0.0 | 0.0 | 0.0 | 0.1 | 0.4 | 0.0 | 0.0 | 0.2 | ||
| 2007 | 0.1 | 0.0 | 0.0 | 0.0 | 0.1 | 0.0 | 0.0 | 0.0 | 0.0 | 0.0 | 0.0 | 0.0 | 0.0 | 0.0 | 0.0 | 0.0 | 0.0 | ||
| 2006 | 0.0 | 0.4 | 0.2 | 0.1 | 0.4 | 0.1 | 0.2 | 0.0 | 0.0 | 0.0 | 0.0 | 0.0 | 0.1 | 0.2 | 0.1 | 0.0 | 0.1 | ||
| 2005 | 0.0 | 0.0 | 0.0 | 0.0 | 0.0 | 0.0 | 0.1 | 0.0 | 0.0 | 0.0 | 0.0 | 0.0 | 0.0 | 0.0 | 0.0 | 0.0 | 0.0 | ||
| 2004 | 0.0 | 0.0 | 0.0 | 0.0 | 0.0 | 0.0 | 0.1 | 0.0 | 0.0 | 0.0 | 0.0 | 0.0 | 0.0 | 0.0 | 0.0 | 0.0 | 0.0 | ||
| 2003 | 0.1 | 0.0 | 0.0 | 0.0 | 0.0 | 0.0 | 0.1 | 0.0 | 0.0 | 0.0 | 0.0 | 0.0 | 0.0 | 0.0 | 0.0 | 0.0 | 0.0 | ||
| 2002 | 0.0 | 0.0 | 0.2 | 0.3 | 0.0 | 0.1 | 0.3 | 0.1 | 0.0 | 0.0 | 0.0 | 0.0 | 0.0 | 0.1 | 0.1 | 0.0 | 0.1 | ||
| 2001 | 0.0 | 0.0 | 0.0 | 0.0 | 0.0 | 0.0 | 0.0 | 0.0 | 0.0 | 0.0 | 0.0 | 0.0 | 0.0 | 0.0 | 0.0 | 0.0 | 0.0 | ||
| 2000 | 0.0 | 0.0 | 0.0 | 0.0 | 0.5 | 0.5 | 0.8 | 0.1 | 0.1 | 0.0 | 0.0 | 0.0 | 0.0 | 0.2 | 0.5 | 0.0 | 0.2 | ||
| 1999 | 0.0 | 0.0 | 0.0 | 0.0 | 0.0 | 0.0 | 0.0 | 0.0 | 0.5 | 0.0 | 0.1 | 0.1 | 0.1 | 0.0 | 0.0 | 0.2 | 0.1 | ||
| 1998 | 0.0 | 0.5 | 0.7 | 2.9 | 2.2 | 0.9 | 0.0 | 5.1 | 0.1 | 0.0 | 1.0 | 0.1 | 0.2 | 1.9 | 1.6 | 0.2 | 1.2 | ||
| 1997 | 0.6 | 1.0 | 1.2 | 2.3 | 3.0 | 6.4 | 0.0 | 1.0 | 0.0 | 0.0 | 0.0 | 0.0 | 0.5 | 2.1 | 3.4 | 0.0 | 1.6 | ||
| 1996 | 0.1 | 2.6 | 1.4 | 2.5 | 10.6 | 9.6 | 2.1 | 2.1 | 1.6 | 3.0 | 1.8 | 1.6 | 1.6 | 5.1 | 4.7 | 2.0 | 3.5 | ||
| 1995 | 0.7 | 0.5 | 1.4 | 1.2 | 4.5 | 5.7 | 2.9 | 0.0 | 0.9 | 1.0 | 0.3 | 0.2 | 0.5 | 2.2 | 3.1 | 0.8 | 1.6 | ||
| 1994 | 1.9 | 1.6 | 1.7 | 3.6 | 1.5 | 2.8 | 7.8 | 2.4 | 2.8 | 1.9 | 1.0 | 0.6 | 1.3 | 2.2 | 4.6 | 1.9 | 2.3 | ||
| 1993 | 0.5 | 0.4 | 0.0 | 1.3 | 0.1 | 2.1 | 1.5 | 6.4 | 1.5 | 4.2 | 0.7 | 2.2 | 1.0 | 0.5 | 2.9 | 2.0 | 1.5 | ||
| 1992 | 1.9 | 0.0 | 1.1 | 0.5 | 0.2 | 1.4 | 1.1 | 2.0 | 1.5 | 3.8 | 0.1 | 1.2 | 1.1 | 0.6 | 1.5 | 1.6 | 1.2 | ||
| 1991 | 0.0 | 0.0 | 0.0 | 0.0 | 0.1 | 0.2 | 2.7 | 2.3 | 0.7 | 2.5 | 0.6 | 0.0 | 0.0 | 0.1 | 1.6 | 1.3 | 0.6 | ||
| 1990 | 0.0 | 0.0 | 0.0 | 0.1 | 0.0 | 0.2 | 1.1 | 1.0 | 0.0 | 1.4 | 0.0 | 0.0 | 0.0 | 0.1 | 0.7 | 0.5 | 0.2 | ||
| 1989 | 0.0 | 0.0 | 0.0 | 0.0 | 0.1 | 0.0 | 0.0 | 0.0 | 0.0 | 0.0 | 0.0 | 0.0 | 0.0 | 0.0 | 0.0 | 0.0 | 0.0 | ||
| 1988 | 0.0 | 0.0 | 0.2 | 0.4 | 0.0 | 0.0 | 0.0 | 0.0 | 0.0 | 0.0 | 0.0 | 0.0 | 0.0 | 0.2 | 0.0 | 0.0 | 0.1 | ||
| 1987 | 0.5 | 0.0 | 0.0 | 0.0 | 0.0 | 0.0 | 0.1 | 0.0 | 0.0 | 0.0 | 0.0 | 0.0 | 0.0 | 0.0 | 0.0 | 0.0 | 0.0 | ||
| 1986 | 0.2 | 0.5 | 0.2 | 0.5 | 0.6 | 0.0 | 0.5 | 0.4 | 0.8 | 0.7 | 0.9 | 0.8 | 0.5 | 0.4 | 0.3 | 0.8 | 0.5 | ||
| 1985 | 0.1 | 0.1 | 0.0 | 0.1 | 0.1 | 0.4 | 9.1 | 2.8 | 1.5 | 0.9 | 2.8 | 0.6 | 0.3 | 0.1 | 1.7 | 1.5 | 0.6 | ||
| 1984 | 0.0 | 0.0 | 3.0 | 3.8 | 2.8 | 6.9 | 0.9 | 0.0 | 0.0 | 0.0 | 0.3 | 0.1 | 0.1 | 3.4 | 1.5 | 0.1 | 0.8 | ||
| 1983 | 6.2 | 11.8 | 16.6 | 16.0 | 51.4 | 9.7 | 63.2 | 19.7 | 1.0 | - | 5.2 | 0.0 | 6.2 | 27.9 | 24.1 | 4.6 | 17.2 | ||
| 1982 | - | 1.3 | - | 0.0 | 0.2 | 27.5 | - | 16.9 | - | 4.0 | - | 3.6 | 2.6 | 0.2 | 22.8 | 4.0 | 9.6 | ||
Reporting rates
Reporting rate is the proportion of all surveys in which the species was present.
Reporting rate by year
This chart shows the reporting rate of Pied Stilt each year between 1982 and 2017. 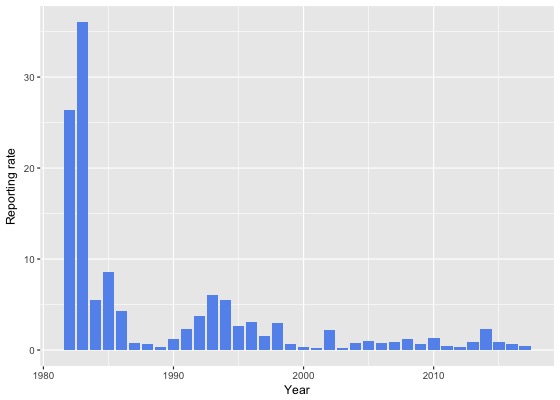
Reporting rate by month
This chart shows the reporting rate by month of Pied Stilt. The blue lines show the reporting rate for the twelve months to June 2017 and the bars show the average reporting rate for the period 1982 to 2017. 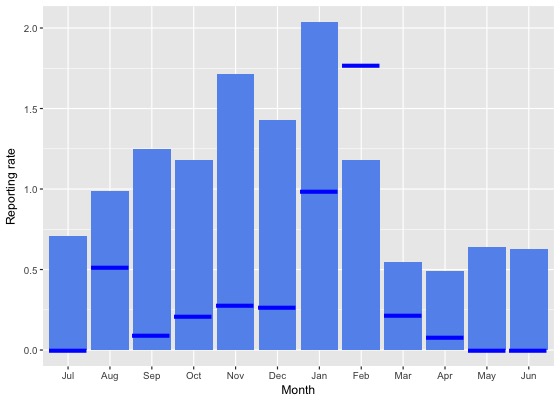
Reporting rate by season
This chart shows the seasonal reporting rate of Pied Stilt. The blue lines show the seasonal reporting rate for the twelve months to June 2017 and the bars show the average seasonal reporting rate for the period 1982 to 2017. 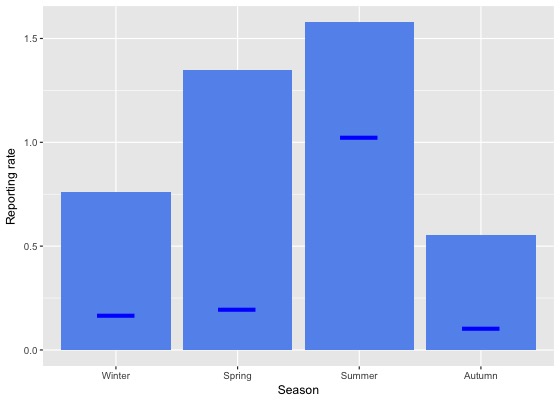
Reporting rate data
| Month | Season | ||||||||||||||||||
|---|---|---|---|---|---|---|---|---|---|---|---|---|---|---|---|---|---|---|---|
| Period | Jul | Aug | Sep | Oct | Nov | Dec | Jan | Feb | Mar | Apr | May | Jun | Winter | Spring | Summer | Autumn | All | ||
| All years | |||||||||||||||||||
| All | 0.7 | 1.0 | 1.2 | 1.2 | 1.7 | 1.4 | 2.0 | 1.2 | 0.5 | 0.5 | 0.6 | 0.6 | 0.8 | 1.3 | 1.6 | 0.6 | 1.1 | ||
| Previous years | |||||||||||||||||||
| All previous years | 0.8 | 1.1 | 1.4 | 1.3 | 1.9 | 1.6 | 2.2 | 1.1 | 0.6 | 0.6 | 0.8 | 0.7 | 0.9 | 1.5 | 1.7 | 0.6 | 1.2 | ||
| Previous 30 years | 0.7 | 0.9 | 1.3 | 1.2 | 1.8 | 1.4 | 2.1 | 0.8 | 0.6 | 0.5 | 0.6 | 0.6 | 0.7 | 1.4 | 1.5 | 0.6 | 1.1 | ||
| Previous 20 years | 0.3 | 0.8 | 1.4 | 1.1 | 1.9 | 1.3 | 1.9 | 0.5 | 0.3 | 0.1 | 0.4 | 0.2 | 0.4 | 1.4 | 1.3 | 0.2 | 0.9 | ||
| 10 year groups | |||||||||||||||||||
| [2007,2017) | 0.3 | 0.8 | 1.6 | 1.2 | 2.5 | 1.4 | 1.3 | 0.3 | 0.2 | 0.2 | 0.5 | 0.2 | 0.4 | 1.6 | 1.1 | 0.2 | 0.9 | ||
| [1997,2007) | 0.3 | 0.8 | 0.9 | 0.8 | 0.8 | 1.1 | 4.0 | 1.1 | 0.4 | 0.1 | 0.3 | 0.3 | 0.4 | 0.8 | 2.0 | 0.2 | 0.9 | ||
| [1987,1997) | 1.9 | 1.3 | 1.1 | 1.7 | 1.5 | 2.0 | 3.0 | 2.1 | 2.4 | 2.2 | 1.6 | 2.4 | 1.9 | 1.5 | 2.4 | 2.0 | 1.9 | ||
| 5 year groups | |||||||||||||||||||
| [2012,2017) | 0.4 | 0.6 | 1.5 | 1.3 | 2.2 | 1.7 | 1.5 | 0.3 | 0.2 | 0.2 | 0.5 | 0.2 | 0.4 | 1.6 | 1.2 | 0.3 | 0.9 | ||
| [2007,2012) | 0.2 | 1.6 | 1.8 | 1.1 | 3.4 | 0.8 | 0.6 | 0.3 | 0.2 | 0.1 | 0.4 | 0.1 | 0.5 | 1.7 | 0.6 | 0.2 | 0.9 | ||
| [2002,2007) | 0.2 | 0.8 | 1.1 | 0.6 | 0.2 | 1.4 | 7.1 | 1.4 | 0.0 | 0.0 | 0.2 | 0.0 | 0.3 | 0.7 | 3.0 | 0.0 | 1.0 | ||
| [1997,2002) | 0.4 | 0.8 | 0.7 | 1.0 | 1.4 | 0.7 | 0.6 | 0.8 | 0.9 | 0.1 | 0.4 | 0.8 | 0.7 | 1.0 | 0.7 | 0.5 | 0.7 | ||
| [1992,1997) | 5.5 | 3.7 | 2.3 | 3.2 | 3.3 | 4.7 | 5.6 | 2.9 | 4.1 | 4.3 | 3.0 | 6.3 | 5.1 | 3.0 | 4.5 | 3.9 | 4.0 | ||
| [1987,1992) | 0.3 | 0.0 | 0.5 | 0.9 | 0.7 | 0.8 | 1.5 | 1.8 | 1.3 | 0.9 | 0.8 | 0.3 | 0.2 | 0.7 | 1.4 | 1.0 | 0.8 | ||
| Year | |||||||||||||||||||
| 2017 | 0.0 | 0.5 | 0.1 | 0.2 | 0.3 | 0.3 | 1.0 | 1.8 | 0.2 | 0.1 | 0.0 | 0.0 | 0.2 | 0.2 | 1.0 | 0.1 | 0.4 | ||
| 2016 | 0.0 | 0.4 | 1.6 | 1.9 | 1.3 | 1.4 | 0.9 | 0.2 | 0.0 | 0.0 | 0.2 | 0.1 | 0.2 | 1.6 | 0.8 | 0.1 | 0.7 | ||
| 2015 | 1.2 | 0.4 | 0.7 | 0.9 | 4.4 | 2.4 | 0.3 | 0.0 | 0.0 | 0.0 | 0.0 | 0.0 | 0.4 | 1.8 | 0.9 | 0.0 | 0.8 | ||
| 2014 | 0.6 | 1.3 | 3.6 | 1.9 | 3.7 | 4.6 | 6.0 | 0.7 | 0.4 | 0.5 | 1.1 | 0.0 | 0.5 | 2.8 | 4.2 | 0.6 | 2.3 | ||
| 2013 | 0.0 | 1.4 | 1.4 | 0.8 | 1.0 | 1.0 | 0.4 | 0.3 | 0.8 | 0.7 | 0.8 | 1.4 | 1.0 | 1.0 | 0.6 | 0.8 | 0.8 | ||
| 2012 | 0.4 | 0.0 | 1.0 | 0.4 | 0.5 | 0.3 | 0.0 | 0.5 | 0.3 | 0.0 | 1.6 | 0.0 | 0.1 | 0.6 | 0.2 | 0.5 | 0.4 | ||
| 2011 | 0.0 | 1.6 | 0.4 | 0.0 | 0.6 | 0.3 | 0.6 | 0.9 | 0.0 | 0.6 | 1.1 | 0.3 | 0.5 | 0.2 | 0.6 | 0.5 | 0.5 | ||
| 2010 | 0.0 | 2.6 | 4.9 | 2.7 | 0.5 | 1.5 | 0.0 | 0.0 | 0.4 | 0.0 | 0.0 | 0.0 | 0.6 | 2.8 | 0.7 | 0.2 | 1.4 | ||
| 2009 | 0.0 | 1.0 | 2.6 | 0.2 | 3.1 | 0.0 | 0.7 | 0.0 | 0.5 | 0.0 | 0.0 | 0.0 | 0.2 | 1.5 | 0.2 | 0.2 | 0.7 | ||
| 2008 | 0.0 | 1.7 | 0.7 | 2.6 | 6.0 | 0.5 | 0.8 | 0.0 | 0.0 | 0.0 | 0.0 | 0.0 | 0.4 | 2.6 | 0.4 | 0.0 | 1.2 | ||
| 2007 | 1.1 | 0.9 | 0.0 | 0.0 | 8.1 | 1.7 | 0.8 | 0.0 | 0.0 | 0.0 | 0.0 | 0.3 | 0.6 | 1.4 | 1.0 | 0.0 | 0.8 | ||
| 2006 | 0.0 | 1.9 | 0.9 | 0.3 | 1.2 | 0.6 | 6.2 | 0.0 | 0.0 | 0.0 | 0.0 | 0.0 | 0.4 | 0.6 | 2.4 | 0.0 | 0.8 | ||
| 2005 | 0.0 | 0.9 | 0.4 | 0.0 | 0.0 | 0.4 | 9.2 | 4.3 | 0.0 | 0.0 | 0.5 | 0.0 | 0.2 | 0.2 | 3.7 | 0.2 | 1.0 | ||
| 2004 | 0.0 | 0.0 | 2.9 | 1.7 | 0.0 | 0.5 | 3.0 | 0.0 | 0.0 | 0.0 | 0.0 | 0.0 | 0.0 | 1.6 | 1.2 | 0.0 | 0.7 | ||
| 2003 | 0.9 | 0.7 | 0.4 | 0.5 | 0.0 | 0.0 | 0.7 | 0.0 | 0.0 | 0.0 | 0.0 | 0.0 | 0.5 | 0.3 | 0.2 | 0.0 | 0.2 | ||
| 2002 | 0.6 | 0.8 | 1.0 | 0.9 | 0.0 | 4.1 | 15.7 | 3.3 | 0.0 | 0.0 | 0.0 | 0.0 | 0.4 | 0.6 | 6.8 | 0.0 | 2.2 | ||
| 2001 | 0.0 | 0.0 | 0.6 | 0.0 | 0.0 | 0.0 | 0.0 | 0.0 | 0.3 | 0.5 | 0.0 | 0.5 | 0.2 | 0.3 | 0.0 | 0.3 | 0.2 | ||
| 2000 | 0.0 | 0.0 | 0.0 | 0.0 | 0.5 | 0.7 | 0.8 | 0.5 | 0.8 | 0.0 | 0.0 | 0.0 | 0.0 | 0.2 | 0.7 | 0.3 | 0.3 | ||
| 1999 | 0.0 | 0.0 | 0.0 | 0.6 | 1.3 | 0.6 | 0.7 | 0.0 | 1.1 | 0.0 | 0.6 | 1.9 | 1.2 | 0.6 | 0.5 | 0.5 | 0.7 | ||
| 1998 | 0.0 | 3.8 | 2.4 | 5.4 | 4.4 | 1.9 | 1.5 | 5.7 | 3.2 | 0.0 | 3.7 | 1.3 | 1.8 | 4.0 | 2.6 | 2.5 | 3.0 | ||
| 1997 | 2.3 | 3.4 | 1.8 | 2.6 | 2.6 | 1.9 | 0.0 | 1.8 | 0.0 | 0.0 | 0.0 | 0.0 | 1.8 | 2.3 | 1.4 | 0.0 | 1.5 | ||
| 1996 | 3.0 | 5.3 | 1.3 | 1.8 | 4.6 | 3.0 | 2.9 | 1.2 | 2.9 | 4.7 | 1.7 | 4.6 | 4.4 | 2.7 | 2.4 | 3.1 | 3.1 | ||
| 1995 | 6.5 | 3.1 | 1.0 | 1.8 | 2.7 | 3.4 | 4.4 | 0.0 | 4.1 | 0.8 | 1.3 | 2.1 | 3.8 | 1.9 | 3.0 | 2.0 | 2.6 | ||
| 1994 | 9.8 | 5.2 | 4.4 | 4.7 | 2.9 | 4.3 | 13.2 | 3.4 | 4.5 | 6.1 | 5.0 | 5.6 | 6.5 | 3.8 | 7.6 | 5.4 | 5.5 | ||
| 1993 | 6.1 | 3.8 | 0.0 | 9.3 | 3.0 | 8.7 | 6.1 | 9.4 | 3.7 | 6.7 | 5.2 | 13.0 | 7.7 | 4.4 | 7.9 | 5.0 | 6.0 | ||
| 1992 | 3.1 | 0.0 | 4.7 | 1.1 | 2.8 | 6.3 | 3.4 | 4.9 | 5.6 | 5.1 | 1.3 | 8.3 | 3.9 | 2.8 | 4.9 | 3.9 | 3.8 | ||
| 1991 | 0.0 | 0.0 | 0.0 | 1.0 | 3.1 | 2.7 | 7.1 | 6.0 | 4.8 | 1.7 | 4.9 | 2.0 | 0.4 | 1.4 | 5.0 | 3.8 | 2.3 | ||
| 1990 | 0.0 | 0.0 | 0.0 | 3.1 | 0.9 | 1.4 | 5.6 | 2.8 | 1.1 | 2.4 | 0.0 | 0.0 | 0.0 | 1.3 | 3.3 | 1.2 | 1.2 | ||
| 1989 | 0.0 | 0.0 | 0.4 | 0.4 | 0.5 | 0.4 | 0.0 | 0.5 | 1.1 | 0.0 | 0.0 | 0.0 | 0.0 | 0.4 | 0.3 | 0.4 | 0.3 | ||
| 1988 | 0.0 | 0.0 | 1.7 | 1.2 | 0.7 | 0.5 | 0.0 | 1.1 | 0.5 | 1.6 | 0.5 | 0.0 | 0.0 | 1.1 | 0.5 | 0.9 | 0.6 | ||
| 1987 | 18.2 | 0.0 | 0.0 | 0.4 | 0.0 | 0.5 | 1.5 | 2.1 | 1.4 | 0.4 | 0.9 | 0.5 | 1.3 | 0.1 | 1.4 | 0.9 | 0.8 | ||
| 1986 | 3.8 | 7.9 | 1.9 | 2.8 | 2.1 | 0.0 | 8.7 | 8.3 | 3.2 | 3.9 | 6.9 | 5.7 | 6.1 | 2.2 | 5.4 | 4.5 | 4.3 | ||
| 1985 | 6.7 | 3.3 | 1.9 | 3.5 | 3.5 | 6.7 | 75.0 | 35.3 | 9.1 | 15.8 | 20.0 | 14.3 | 8.0 | 3.1 | 18.8 | 15.0 | 8.6 | ||
| 1984 | 0.0 | 0.0 | 40.0 | 33.3 | 25.0 | 16.7 | 3.4 | 0.0 | 0.0 | 0.0 | 6.5 | 2.9 | 2.0 | 33.3 | 4.1 | 2.2 | 5.5 | ||
| 1983 | 66.7 | 33.3 | 80.0 | 38.5 | 44.4 | 30.8 | 66.7 | 36.4 | 50.0 | - | 16.7 | 0.0 | 27.6 | 48.1 | 40.0 | 21.4 | 36.0 | ||
| 1982 | - | 9.1 | - | 0.0 | 12.5 | 35.7 | - | 45.5 | - | 23.1 | - | 28.6 | 20.0 | 11.1 | 40.0 | 23.1 | 26.4 | ||
Breeding data
Breeding records by month
Number of breeding records by breeding code and month, 2017 and all years| Breeding code | Jul | Aug | Sep | Oct | Nov | Dec | Jan | Feb | Mar | Apr | May | Jun |
|---|---|---|---|---|---|---|---|---|---|---|---|---|
| 2017 | ||||||||||||
| Breeding (BLA code) | 0 | 0 | 0 | 0 | 0 | 0 | 0 | 0 | 0 | 0 | 0 | 0 |
| Carrying Food | 0 | 0 | 0 | 0 | 0 | 0 | 0 | 0 | 0 | 0 | 0 | 0 |
| Copulating | 0 | 0 | 0 | 0 | 0 | 0 | 0 | 0 | 0 | 0 | 0 | 0 |
| Display | 0 | 0 | 0 | 0 | 0 | 0 | 0 | 0 | 0 | 0 | 0 | 0 |
| Dependent young | 0 | 0 | 0 | 2 | 1 | 1 | 1 | 0 | 0 | 0 | 0 | 0 |
| Faecal sac | 0 | 0 | 0 | 0 | 0 | 0 | 0 | 0 | 0 | 0 | 0 | 0 |
| Inspecting hollow | 0 | 0 | 0 | 0 | 0 | 0 | 0 | 0 | 0 | 0 | 0 | 0 |
| Nest building | 0 | 0 | 0 | 0 | 0 | 0 | 0 | 0 | 0 | 0 | 0 | 0 |
| Nest with eggs | 0 | 0 | 0 | 0 | 0 | 0 | 0 | 0 | 0 | 0 | 0 | 0 |
| Nest with young | 0 | 0 | 0 | 0 | 0 | 0 | 0 | 0 | 0 | 0 | 0 | 0 |
| On/leaving nest | 0 | 0 | 0 | 0 | 0 | 0 | 0 | 0 | 0 | 0 | 0 | 0 |
| All years | ||||||||||||
| Breeding (BLA code) | 0 | 0 | 0 | 0 | 0 | 0 | 0 | 0 | 0 | 0 | 1 | 0 |
| Carrying Food | 0 | 0 | 0 | 0 | 0 | 0 | 0 | 0 | 0 | 0 | 0 | 0 |
| Copulating | 0 | 0 | 0 | 0 | 0 | 0 | 0 | 0 | 0 | 0 | 0 | 0 |
| Display | 0 | 0 | 0 | 0 | 0 | 0 | 0 | 0 | 0 | 0 | 0 | 0 |
| Dependent young | 0 | 0 | 0 | 2 | 1 | 1 | 2 | 3 | 0 | 0 | 0 | 0 |
| Faecal sac | 0 | 0 | 0 | 0 | 0 | 0 | 0 | 0 | 0 | 0 | 0 | 0 |
| Inspecting hollow | 0 | 0 | 0 | 0 | 0 | 0 | 0 | 0 | 0 | 0 | 0 | 0 |
| Nest building | 0 | 0 | 0 | 0 | 0 | 0 | 0 | 0 | 0 | 0 | 0 | 0 |
| Nest with eggs | 0 | 0 | 0 | 0 | 0 | 0 | 1 | 0 | 0 | 0 | 0 | 0 |
| Nest with young | 0 | 0 | 0 | 0 | 0 | 0 | 0 | 0 | 0 | 0 | 0 | 0 |
| On/leaving nest | 0 | 0 | 2 | 2 | 3 | 2 | 0 | 0 | 0 | 0 | 0 | 0 |
Breeding records by year
Average number of breeding records per period by breeding code| Period | Breeding (BLA code) | Carrying Food | Copulating | Display | Dependent young | Faecal sac | Inspecting hollow | Nest building | Nest with eggs | Nest with young | On/leaving nest |
|---|---|---|---|---|---|---|---|---|---|---|---|
| All years | |||||||||||
| All | 0.0 | 0.0 | 0.0 | 0.0 | 0.2 | 0.0 | 0.0 | 0.0 | 0.0 | 0.0 | 0.2 |
| Previous years | |||||||||||
| All previous years | 0.0 | 0.0 | 0.0 | 0.0 | 0.1 | 0.0 | 0.0 | 0.0 | 0.0 | 0.0 | 0.3 |
| Previous 30 years | 0.0 | 0.0 | 0.0 | 0.0 | 0.1 | 0.0 | 0.0 | 0.0 | 0.0 | 0.0 | 0.3 |
| Previous 20 years | 0.0 | 0.0 | 0.0 | 0.0 | 0.1 | 0.0 | 0.0 | 0.0 | 0.0 | 0.0 | 0.1 |
| 10 year groups | |||||||||||
| [2007,2017) | 0.1 | 0.0 | 0.0 | 0.0 | 0.2 | 0.0 | 0.0 | 0.0 | 0.1 | 0.0 | 0.1 |
| [1997,2007) | 0.0 | 0.0 | 0.0 | 0.0 | 0.0 | 0.0 | 0.0 | 0.0 | 0.0 | 0.0 | 0.2 |
| [1987,1997) | 0.0 | 0.0 | 0.0 | 0.0 | 0.2 | 0.0 | 0.0 | 0.0 | 0.0 | 0.0 | 0.6 |
| 5 year groups | |||||||||||
| [2012,2017) | 0.2 | 0.0 | 0.0 | 0.0 | 0.0 | 0.0 | 0.0 | 0.0 | 0.0 | 0.0 | 0.2 |
| [2007,2012) | 0.0 | 0.0 | 0.0 | 0.0 | 0.4 | 0.0 | 0.0 | 0.0 | 0.2 | 0.0 | 0.0 |
| [2002,2007) | 0.0 | 0.0 | 0.0 | 0.0 | 0.0 | 0.0 | 0.0 | 0.0 | 0.0 | 0.0 | 0.2 |
| [1997,2002) | 0.0 | 0.0 | 0.0 | 0.0 | 0.0 | 0.0 | 0.0 | 0.0 | 0.0 | 0.0 | 0.2 |
| [1992,1997) | 0.0 | 0.0 | 0.0 | 0.0 | 0.4 | 0.0 | 0.0 | 0.0 | 0.0 | 0.0 | 1.2 |
| [1987,1992) | 0.0 | 0.0 | 0.0 | 0.0 | 0.0 | 0.0 | 0.0 | 0.0 | 0.0 | 0.0 | 0.0 |
| Year | |||||||||||
| 2017 | 0.0 | 0.0 | 0.0 | 0.0 | 5.0 | 0.0 | 0.0 | 0.0 | 0.0 | 0.0 | 0.0 |
| 2016 | 0.0 | 0.0 | 0.0 | 0.0 | 0.0 | 0.0 | 0.0 | 0.0 | 0.0 | 0.0 | 0.0 |
| 2015 | 0.0 | 0.0 | 0.0 | 0.0 | 0.0 | 0.0 | 0.0 | 0.0 | 0.0 | 0.0 | 1.0 |
| 2014 | 0.0 | 0.0 | 0.0 | 0.0 | 0.0 | 0.0 | 0.0 | 0.0 | 0.0 | 0.0 | 0.0 |
| 2013 | 0.0 | 0.0 | 0.0 | 0.0 | 0.0 | 0.0 | 0.0 | 0.0 | 0.0 | 0.0 | 0.0 |
| 2012 | 1.0 | 0.0 | 0.0 | 0.0 | 0.0 | 0.0 | 0.0 | 0.0 | 0.0 | 0.0 | 0.0 |
| 2011 | 0.0 | 0.0 | 0.0 | 0.0 | 2.0 | 0.0 | 0.0 | 0.0 | 1.0 | 0.0 | 0.0 |
| 2010 | 0.0 | 0.0 | 0.0 | 0.0 | 0.0 | 0.0 | 0.0 | 0.0 | 0.0 | 0.0 | 0.0 |
| 2009 | 0.0 | 0.0 | 0.0 | 0.0 | 0.0 | 0.0 | 0.0 | 0.0 | 0.0 | 0.0 | 0.0 |
| 2008 | 0.0 | 0.0 | 0.0 | 0.0 | 0.0 | 0.0 | 0.0 | 0.0 | 0.0 | 0.0 | 0.0 |
| 2007 | 0.0 | 0.0 | 0.0 | 0.0 | 0.0 | 0.0 | 0.0 | 0.0 | 0.0 | 0.0 | 0.0 |
| 2006 | 0.0 | 0.0 | 0.0 | 0.0 | 0.0 | 0.0 | 0.0 | 0.0 | 0.0 | 0.0 | 1.0 |
| 2005 | 0.0 | 0.0 | 0.0 | 0.0 | 0.0 | 0.0 | 0.0 | 0.0 | 0.0 | 0.0 | 0.0 |
| 2004 | 0.0 | 0.0 | 0.0 | 0.0 | 0.0 | 0.0 | 0.0 | 0.0 | 0.0 | 0.0 | 0.0 |
| 2003 | 0.0 | 0.0 | 0.0 | 0.0 | 0.0 | 0.0 | 0.0 | 0.0 | 0.0 | 0.0 | 0.0 |
| 2002 | 0.0 | 0.0 | 0.0 | 0.0 | 0.0 | 0.0 | 0.0 | 0.0 | 0.0 | 0.0 | 0.0 |
| 2001 | 0.0 | 0.0 | 0.0 | 0.0 | 0.0 | 0.0 | 0.0 | 0.0 | 0.0 | 0.0 | 0.0 |
| 2000 | 0.0 | 0.0 | 0.0 | 0.0 | 0.0 | 0.0 | 0.0 | 0.0 | 0.0 | 0.0 | 0.0 |
| 1999 | 0.0 | 0.0 | 0.0 | 0.0 | 0.0 | 0.0 | 0.0 | 0.0 | 0.0 | 0.0 | 0.0 |
| 1998 | 0.0 | 0.0 | 0.0 | 0.0 | 0.0 | 0.0 | 0.0 | 0.0 | 0.0 | 0.0 | 0.0 |
| 1997 | 0.0 | 0.0 | 0.0 | 0.0 | 0.0 | 0.0 | 0.0 | 0.0 | 0.0 | 0.0 | 1.0 |
| 1996 | 0.0 | 0.0 | 0.0 | 0.0 | 0.0 | 0.0 | 0.0 | 0.0 | 0.0 | 0.0 | 0.0 |
| 1995 | 0.0 | 0.0 | 0.0 | 0.0 | 0.0 | 0.0 | 0.0 | 0.0 | 0.0 | 0.0 | 0.0 |
| 1994 | 0.0 | 0.0 | 0.0 | 0.0 | 2.0 | 0.0 | 0.0 | 0.0 | 0.0 | 0.0 | 6.0 |
| 1993 | 0.0 | 0.0 | 0.0 | 0.0 | 0.0 | 0.0 | 0.0 | 0.0 | 0.0 | 0.0 | 0.0 |
| 1992 | 0.0 | 0.0 | 0.0 | 0.0 | 0.0 | 0.0 | 0.0 | 0.0 | 0.0 | 0.0 | 0.0 |
| 1991 | 0.0 | 0.0 | 0.0 | 0.0 | 0.0 | 0.0 | 0.0 | 0.0 | 0.0 | 0.0 | 0.0 |
| 1990 | 0.0 | 0.0 | 0.0 | 0.0 | 0.0 | 0.0 | 0.0 | 0.0 | 0.0 | 0.0 | 0.0 |
| 1989 | 0.0 | 0.0 | 0.0 | 0.0 | 0.0 | 0.0 | 0.0 | 0.0 | 0.0 | 0.0 | 0.0 |
| 1988 | 0.0 | 0.0 | 0.0 | 0.0 | 0.0 | 0.0 | 0.0 | 0.0 | 0.0 | 0.0 | 0.0 |
| 1987 | 0.0 | 0.0 | 0.0 | 0.0 | 0.0 | 0.0 | 0.0 | 0.0 | 0.0 | 0.0 | 0.0 |
| 1986 | 0.0 | 0.0 | 0.0 | 0.0 | 0.0 | 0.0 | 0.0 | 0.0 | 0.0 | 0.0 | 0.0 |
| 1985 | 0.0 | 0.0 | 0.0 | 0.0 | 0.0 | 0.0 | 0.0 | 0.0 | 0.0 | 0.0 | 0.0 |
| 1984 | 0.0 | 0.0 | 0.0 | 0.0 | 0.0 | 0.0 | 0.0 | 0.0 | 0.0 | 0.0 | 0.0 |
| 1983 | 0.0 | 0.0 | 0.0 | 0.0 | 0.0 | 0.0 | 0.0 | 0.0 | 0.0 | 0.0 | 0.0 |
| 1982 | 0.0 | 0.0 | 0.0 | 0.0 | 0.0 | 0.0 | 0.0 | 0.0 | 0.0 | 0.0 | 0.0 |
Distribution map
Distribution - 2017
This map shows the observed distribution of the Pied Stilt for 2017.
The red circles are the grid cells where Pied Stilt have been reported.
The transparency of the red circles indicate how many surveys sheets were submitted for that grid cell; the darker the red the more reliable the data. Of the 315 grid cells with reports, 83 had only one sheet; an example is grid number A11.
The size of the circle represents the reporting rate. The maximum reporting rate for Pied Stilt was 52.0% (eg grid number Z8) and the minimum was 1.7% (eg grid number L14). 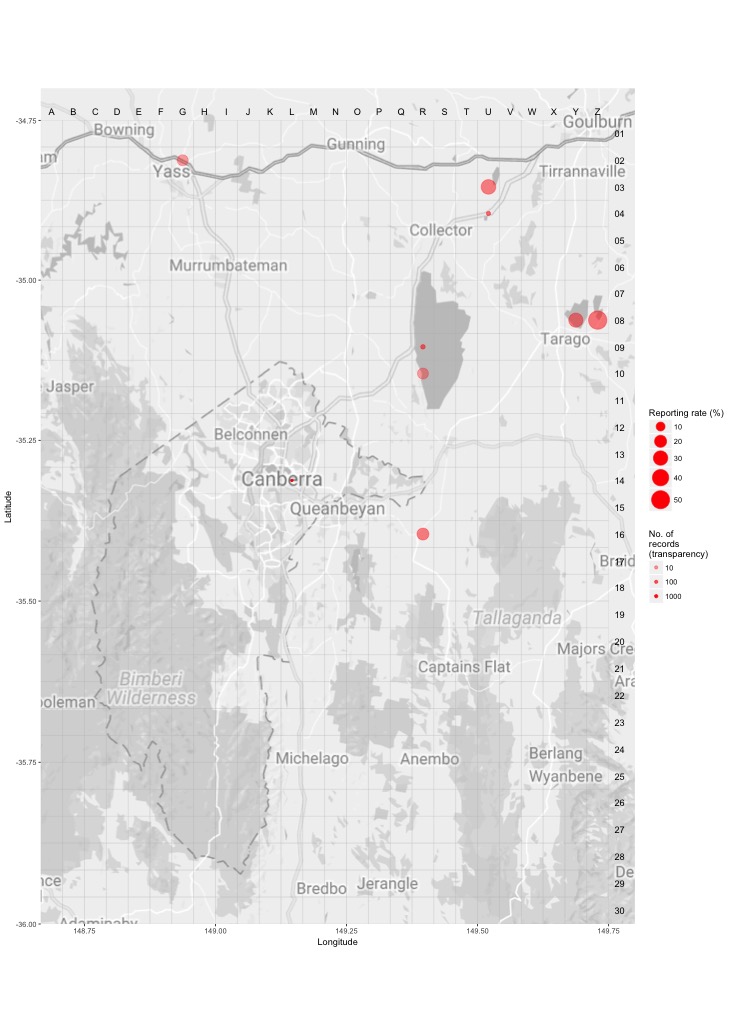
Distribution - all years
This map shows the observed distribution of the Pied Stilt for all years.
The red circles are the grid cells where Pied Stilt have been reported.
The transparency of the red circles indicate how many surveys sheets were submitted for that grid cell; the darker the red the more reliable the data. Of the 703 grid cells with reports, 55 had only one sheet; an example is grid number A12.
The size of the circle represents the reporting rate. The maximum reporting rate for Pied Stilt was 43.6% (eg grid number R6) and the minimum was 0.0% (eg grid number L11). 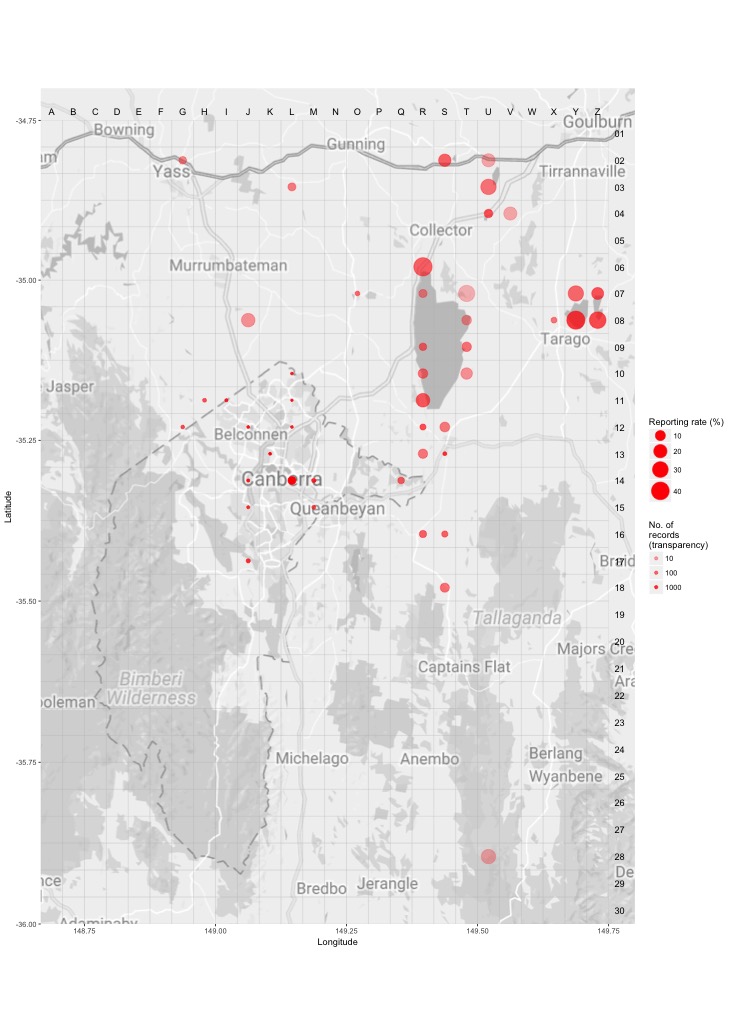
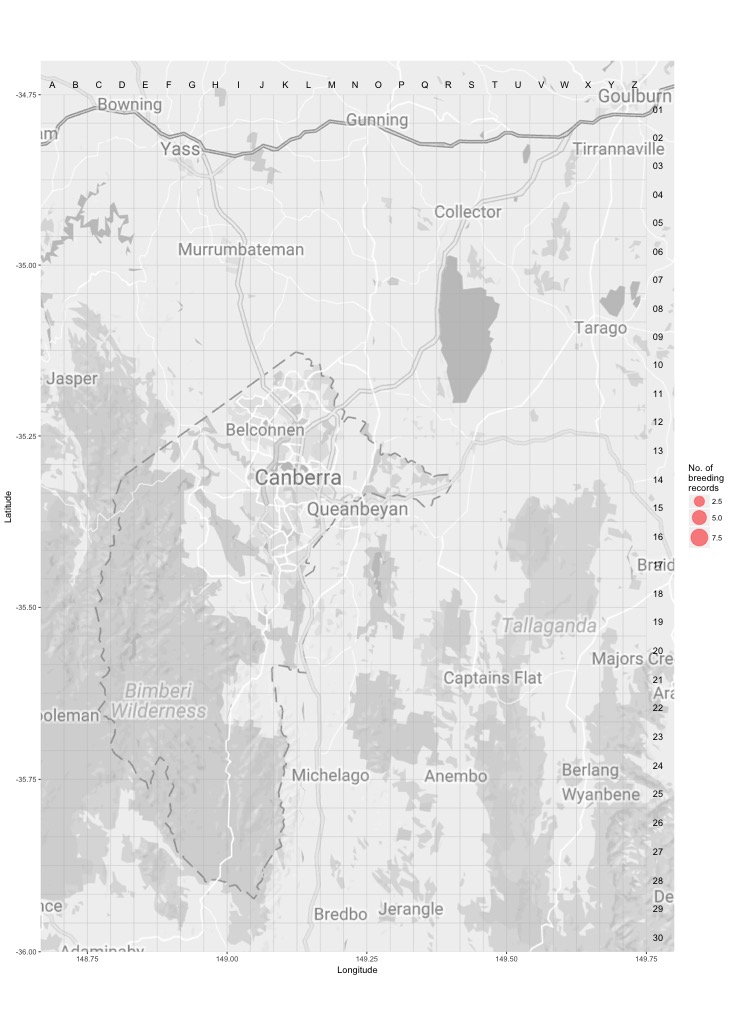
Breeding map
Breeding - 2017
This map shows the breeding distribution of the Pied Stilt for 2017.
The red circles are the grid cells where breeding activity for Pied Stilt have been reported.
The size of the circle represents the number of reports. 
Breeding - all years
This map shows the breeding distribution of the Pied Stilt for all years.
The red circles are the grid cells where breeding activity for Pied Stilt have been reported.
The size of the circle represents the number of reports.